0
items
$0

Vacancy Report Q2 2024
Introduction
The purpose of this survey is to show vacancy and rental rate trends among single-family homes and multi-family units in Ada and Canyon County. Survey results are displayed by type (single or multi-family) & bedrooms (1-5) for the respective county. Property status was surveyed as of June 30, 2024.
The survey participants are property management companies affiliated with the SW Idaho Chapter of NARPM and are considered to be the representative sample of the inventory
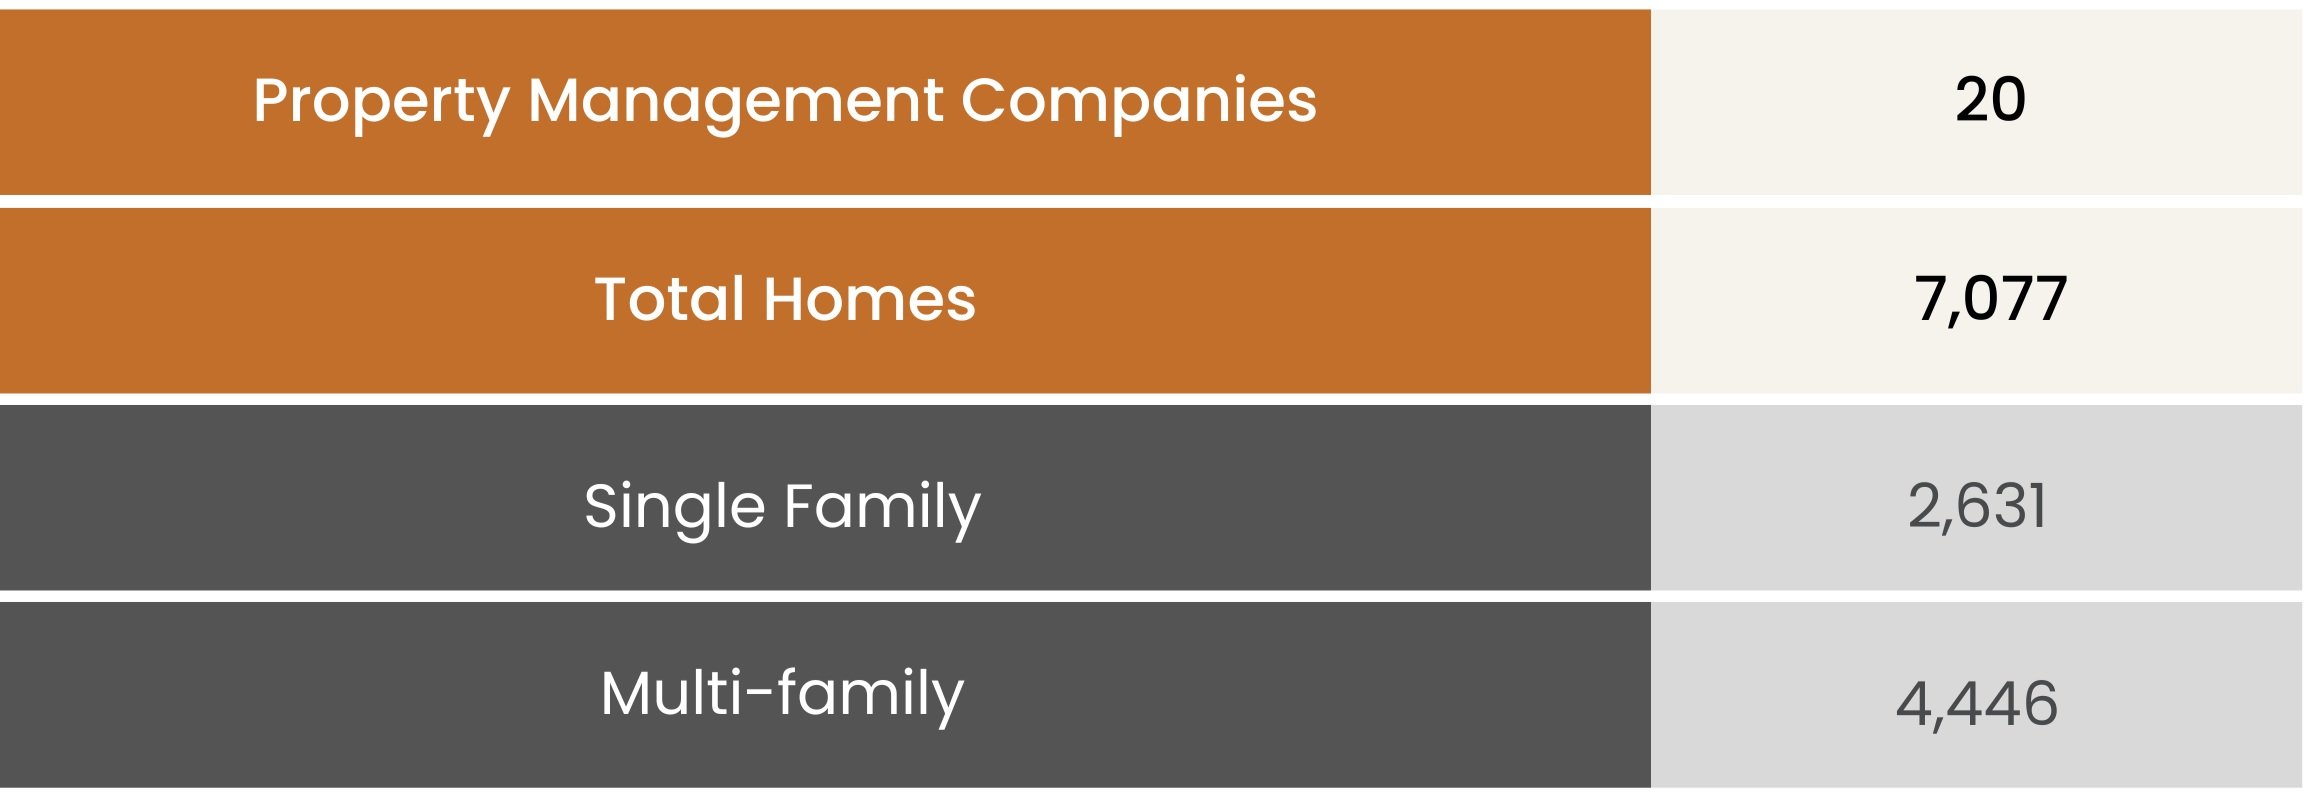
Survey Respondents
Data statistics below:
*The accuracy and reliability of this survey is improved with an increased sampling.

ADA VACANCY REPORT
CANYON VACANCY REPORT
Source: www.narpm.org